Filtering commands help you filter the search results.
To conduct searches on search results use the search command. It searches on dynamic fields returned from the norm, rex, and the table commands.
Note
It is not advised to use the search command unless absolutely necessary. The reason for this is that the search command uses heavy resources. So, it is always better to apply any kind of filtering before using the search command.
To search for users who have logged in more than 5 times:
login user = * | chart count() as count_user by user | search count_user > 5
If you create a dynamic field new field using norm command as,
| norm actual_mps = < new_field:int >
To view the logs which have 100 as the value of the new field, use the search command as:
| norm actual_mps = < new_field:int >|search new_field = 100
We recommend you to use the search command only in the following cases:
When you need to filter the results for simple search (non key-value search).
For example:
| search error
When you need to filter the results using the or logical operator.
For example:
| search device_name=localhost or col_type=filesystem
The filter command lets you further filter the logs retrieved in the search results. Logpoint uses the filter command to drill-down on the search results. The search command is more efficient as it does not index intermediate fields.
Note
The filter command filters the results based on dynamic fields returned from the norm, rex, and table commands as well.
The filter command only works with expressions having the =, >, <, >=, and <= operators.
To filter the results with more than one condition, you must chain multiple filter expressions.
Syntax:
<search query> | filter <condition>
For example, to display only the domains that have more than 10 events associated with them in the search results, use the following query:
norm_id=*Firewall url=* | process domain(url) as domain | chart count() as events by domain | filter
events>10
The query searches for all the logs containing the fields url and norm_id with the value of norm_id having Firewall at the end. It then adds a new field domain to the logs based on the respective URLs and groups the results by their domains. Finally, the filter command limits the results to only those domains that have more than 10 events associated with them.
The latest command finds the most recent log messages for every unique combination of provided field values.
| latest by device_ip | timechart count() by device_ip
This query searches for the latest logs of all the devices.
status = down port = 80 | latest on log_ts by device_ip
This query searches for all the latest devices based on the log_ts field whose web server running on the port number 80 is down.
Use order by to sort the search results based on a numeric field in either ascending or descending order. The sorting order of the search results is inconsistent when a search query does not contain an order sorting command. Use the order by command to make it consistent.
For simple searches that do not contain aggregation or correlation queries, the command can sort the search results based on only timestamp fields such as log_ts and col_ts. However, for other searches, all fields are supported.
Examples:
device_name= "John Doe" and col_type="syslog" | order by col_ts asc
This query searches for all the syslog messages generated from the device named John Doe and sorts them in the ascending order of their col_ts values.
device_name=* | order by log_ts desc
This query searches for the logs from all the devices in the system and sorts them in the descending order of their log_ts values.
device_name=* | chart count() by email, log_ts order by log_ts asc
This query filters logs where device_name exists, then counts occurrences grouped by email and log_ts, and sorts the results in ascending order of log_ts.
Use the limit <number> command to limit the number of results displayed. Additionally, you can add the other keyword at the end of the query to display the aggregation of the rest of the results.
Note
The feature to display the Top-10 and the Rest graphs is supported for the aggregation queries.
While using the limit <number> command to retrieve a large volume of logs, make sure that your system has enough resources to load and render the data.
Example:
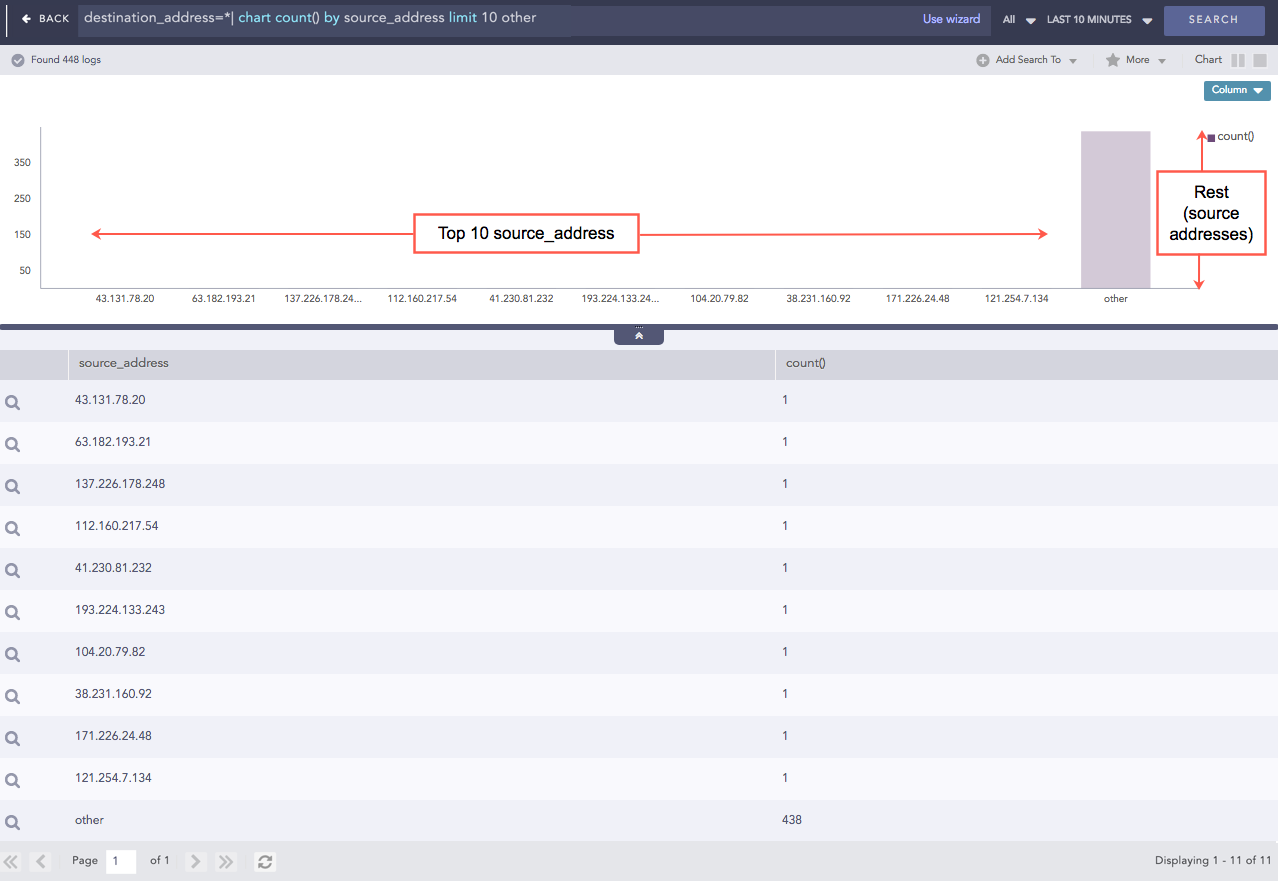
destination_address = * | chart count() by source_address limit 10 other
This query searches for all the logs having a destination address, filters the top 10 results by their source address and rolls-up all the remaining results in the eleventh line. The source_address field displays the word other in the table as shown in the figure below.
Some other working examples:
device_ip=*| chart count() by action, source_address limit 5 other

| chart sum(actual_mps) by service limit 20 other

| chart count() by action limit 10 other